I’m getting a hard fault at my LPC4078 on LPCXpresso and would be very glad if you could help me finding the root cause.
The µC runs with freeRTOS 8.2.0. Apart from a freeRTOS update and to know if it has ever anything to do with freeRTOS, how can I proceed to find the root cause?
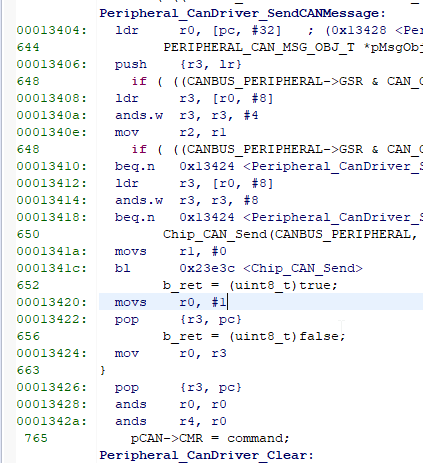
When the hard fault occurs it hangs on this position:
First, do you have configASSERT() defined (and using a recent version of FreeRTOS will make configASSERT() much more effective as recent versions do a lot more checks of your hardware configuration), stack overflow checking on, etc.? See https://www.freertos.org/FAQHelp.html
The CFSR register is 0x20000 - so bit 17 is set indicating an INVSTATE fault. Which, according to that link, means:
Invalid state UsageFault:

0 = no invalid state UsageFault

1 = the processor has attempted to execute an instruction that makes illegal use of the EPSR.

When this bit is set to 1, the PC value stacked for the exception return points to the instruction that attempted the illegal use of the EPSR.

This bit is not set to 1 if an undefined instruction uses the EPSR.
That is only somewhat helpful though…
Can you determine the sequence of execution that leads to the hard fault?
It may be helpful to check the code at LR location:
lr volatile uint32_t 0x12f89 (Hex)
Also, HFSR shows a FORCED or escalated fault. It will be useful to enable Memory Management Fault, Bus Fault, and Usage Fault exceptions as mentioned in this AppNote: https://www.keil.com/appnotes/files/apnt209.pdf
Relevant code snippet from the above doc (assuming you use CMSIS):
LR is 0xFFFFFFFD which mean the exception frame is stored on PSP. So you need to examine 0x10008A08.
The stored PC is 0x0 and the LR is 0x00013421 which as you show in the next image is the next instruction to Chip_CAN_Send. So something in Chip_CAN_Send is corrupting PC.
If this is easily reproducible, can you put a breakpoint at Chip_CAN_Send call and step through the code?
To reproduce I activate PLC process data communication and after 9-10 seconds the system hangs in UsageFault_Handler() while-loop.
Chip_CAN_Send() is called the whole time and many times per second. A breakpoint would stop my system immediately. What would you suggest to trigger?
Are there any parameters which could lead to a corrupt PC, e.g. stack overflow? Aren’t there any mechanisms to recognize stack overflow?
In freeRTOS I alread set configCHECK_FOR_STACK_OVERFLOW to 1 but maybe it’s not recognized in all circumstances. How can I check stack overflow of native system beyond freeRTOS?
Stack overflow check of 1 only check is the stack pointer is out of bounds at the time of the context switch. 2 looks at the stack for signs of previous overruns.
One thing to do is to set the configCHECK_FOR_STACK_OVERFLOW to 2 as Richard mentioned. How many tasks call Chip_CAN_Send?
Lets first isolate the problem - if you disable the task which calls Chip_CAN_Send, does the problem go away? If so, can you increase the stack size for this task?
Thank you @richard-damon and @aggarg for the suggestions.
I’ll try next week setting configCHECK_FOR_STACK_OVERFLOW to 2 and increase stack size.
I know that this function is called from different positions and many times. Since it’s a basic function I cannot disable it (problem won’t exist anymore).
In vTaskList() I didn’t recognize the time before UsageFault_Handler() that any stack size of a task is decreasing near to zero.
I tried configCHECK_FOR_STACK_OVERFLOW setting to 2 but unfortunately that doesn’t change anything.
Is that stack frame layout from Cortex-M4 user guide correct?
What I know:
When I reproduce the error LR (byte 6 of stack frame) always points shortly after the mentioned function Chip_CAN_Send().
When the byte after LR (PC?) is 0 then I get a UsageFault with UFSR_INVSTATE=1
When the byte after LR is another invalid memory address (e.g. 0x14000000) then I get a BusFault with BFSR_IBUSERR=1 (this is very rarely)
I checked available stacksizes of my tasks with vTaskList() and all of them seem to have enough. But of course I don’t know if there happens something special and at once all of the stack is consumed
Compiler-Output of RAM is: RamLoc64: 64200 B 64 KB 97.96% RamPeriph32: 31728 B 31 KB 99.95%
Free available RAM is very less because we set configTOTAL_HEAP_SIZE of FreeRTOS as big as possible to avoid any stack overflows in FreeRTOS - tasks. How can I check stack overflow of µC itself or increase stack size? (it seems stack is simply placed at the end of RAM without any dedicated address?)
Do you have any idea how to find out the cause of the corrupt stack frame with PC=0?
I tried with a “watchpoint” to address 0x10008A28 when this is 0 but it triggers all the time although when it isn’t 0, so triggering doesn’t seem to work correctly. Triggering Chip_CAN_Send is also very difficult because it’s called all the time and works as expected.
Yes, the stack frame from the hardware manual is correct - that is hardware controlled, so has nothing to do with anything FreeRTOS does.
I’m not sure how you are getting a 6 byte offset to find the LR - which end of the stack is that offset from? Each stacked item is 4 bytes.
Can you confirm you have configASSERT() defined? I would then recommend you update your FreeRTOS version as there have been many enhancements designed to help you trap incorrect interrupt priority configurations with configASSERT() since the version you are using.
Can you find out what does the address 0x10008A28 contain? Is it part of the task stack? If so, a way to debug can be to create the task statically using xTaskCreateStatic so that you control the stack buffer. You can then put a data breakpoint at the last byte of the stack buffer to catch stack overflow.
  StackType_t xStackBuffer[ STACK_SIZE ];

  xHandle = xTaskCreateStatic( vTaskCode,             /* Function that implements the task. */
                               "Task_Name",           /* Text name for the task. */
                                STACK_SIZE,           /* Stack size in words, not bytes. */
                                NULL,                 /* Parameter passed into the task. */
                                tskIDLE_PRIORITY,     /* Priority. */
                                &( xStackBuffer[ 0 ], /* Memory to use as the task's stack. */
                                &( xTaskBuffer ) );   /* Memory to hold the task's TCB. */

/* Now put a data breakpoint at &( xStackBuffer[ 0 ] ) - this will catch
 * stack overflow.  Note that the stack grows down on Cortex-M4 and
 * therefore, the data breakpoint should be placed at  &( xStackBuffer[ 0 ] )  as
 * opposed to  &(xStackBuffer[ STACK_SIZE  - 1 ]).  */
Unfortunately, that technique doesn’t work reliably for the same reason that the built-in stack overflow cxheck doesn’t work reliably. Assume the stack is close to its end, and the caller task calls a function that does something like that:
SomeFn()
{
    unsigned char aBuf[20];
    ....
}
That function while executing may not touch all of the 20 bytes it set aside.
Also, you don’t need a static task; you can program the DWT on the fly with any dynamically determined trigger address at runtime.
Now I found a software bug but unfortunately don’t understand what causes the corrupted task stack frame.
In rarely cases when the BusFault instead of UsageFault - error occured I recognized a unique 32bit - value at stacked PC position. Searched the whole RAM area for this value and found it in addition to that PC position at another RAM address. Map-File shows an array around that position. I examined that array and found out that the index counter of that array is in error case too high and exceeds the bounds of the array. A classic programming bug (luckily it’s not implemented by me :-))
When I increase the mentioned array the error definitely doesn’t occure anymore.
I think it’s not necessary to understand the “voodoo magic” what happens after there’s a write exceeding the array bounds. I see some variables after the array are set to invalid values and there’s a function call, where values of the array are passed. But that doesn’t explain, why passed values are stored at “stacked PC” position and not behind where local variables etc are stored in the frame. Step over in debugger isn’t enough, I’ve got to start “running” until UsageFault happens after that exceeding write access.
Are there some possibilities to avoid array out-of-bounds write accesses? Of course you can implement if-conditions to trap it or you’ve got to comply MISRA-C rules. But isn’t there a MPU in LPC4078 which identifies such invalid write accesses?
@richard-damon@rtel@aggarg Thank you very much for your support. Luckily I don’t need to proceed deeper investigations. I learned a lot of things the last days in Cortex-M4 programming!
Of course I meant 6 “double words” (or 6 items) offset. Sorry for confusion.
well, ok. Now we are talking taste though about which there is nothing to debate…
I personally don’t like the idea of burning cycles for no other reason than gaining a little bit more error checking (even only in a debug scenario; if you activate this via #ifdef DEBUGVERSION, you gain differing runtime behavior which has its own problems). It potentially bloats the code significantly, sometimes very unintuitively - consider the code
If you compile that for, say, an ARM Cortex, it may inline the function and generate unfolded code when the compiler can determine the size at compile time. You’d be surprised how much more footprint (-Ot) or execution time (-Os) that can cause , factually changing the runtime behavior…
Also, can you think of a technique to catch the following?


